Recently I was asked to make a program which copies files in a directory but for each file copied skip the first 0x1000 bytes. I thought yeah sure I can do that lol. I went ahead and worked on it and decided to add a feature. The ability to specify the size instead of a fixed value of 0x1000. The other requirement was that he wanted it to be a drag and drop application and because of that you cant really enter command line args via drag and drop so I thought I'd repeat what I've done before for one of my other programs. I used the file name of the executable to determine the length of bytes to skip.
So if I wanted to say skip 255 bytes I would rename the executable to TRIMxff.exe or TRIMxFF.exe
This has the added bonus of making copies of the TRIMx program all with different lengths to skip and when you want to just conveniently drag and drop your file over the respective one.
The processed files will appear in the same location as their originals with the string "TRIM_" leading the original file name.
DOWNLOAD: https://www.mediafire.com/file/9eh5hzmhm0wkrnm/TRIMx.exe
Wednesday, November 22, 2017
Friday, November 17, 2017
MonoGame 3.6 VisualBasic template for Visual Studios 2017
A while back while working on my game I was on Visual Studios 2015 I used a template that I found for VB since MonoGame dropped support for VB. Fast forward a little bit and I'm now on Visual Studios 2017 and MonoGame 3.6. I went to look for that template file since I lost it between reinstalling Windows multiple times but couldn't find it so I figured 'how hard could it be to just make the template', since the template I was using was converted from the C# template. Turns out it isn't hard at all.

Here is a download link to the template: http://www.mediafire.com/file/zga4e5a54m465pa/Windows.VB.zip
To install it just place the Windows.VB.zip file to "\Documents\Visual Studio 2017\Templates\ProjectTemplates\Visual Basic\MonoGame" creating any folders that are needed.

Here is a download link to the template: http://www.mediafire.com/file/zga4e5a54m465pa/Windows.VB.zip
To install it just place the Windows.VB.zip file to "\Documents\Visual Studio 2017\Templates\ProjectTemplates\Visual Basic\MonoGame" creating any folders that are needed.
Monday, October 16, 2017
Localization Processor
A friend of mine who goes by the alias Robert J Stanley (No Relation) is working on his PHD and he deals with some of the most intense work I can think of or maybe because I don't understand it lol. He has to deal with aligning and sequencing genes, mutating bacteria and cells, testing on rats and much more I'm sure, He really is a workaholic lol. Having said that even with great people there comes a time when you wished you could do your work faster and/or better. He originally came to me asking for me to make a script to automate a certain program (ImageJ) which supposedly is a standard when it comes to doing what ever it is he is doing at the moment. He showed me the process of what he had to do and I thought at first it would be a pain to write a script for this program to do everything he wanted, so instead I told him I would make an entirely new program to do everything he asked and a bit more.
The Task:
1) So what he needed to do originally in ImageJ was to essentially greyscale 2 to 3 images.
2) Next he needed to isolate meaningful structures out of it by removing the background.
3) Then came the part where he would have to take those 2or3 images and overlap them.
4) Calculate the percentage at which the two overlap which would signify localization.
*There are more detailed steps that he had to do but I don't entirely remember.
So lets make a checklist to show the process of me making this program for him:
I will be using these 2 images to demonstrate.
GFP:

TxRed:

1) First I needed to greyscale the images. I didn't see a need for this as the images provided were already only in 1 channel each.
Like the first image only had values in the red channel and image 2 only had values in the green channel, etc. These values were 0-255 so if you look at it simply by their values per channel then its already kind of a greyscale image. So I guess that is done.
2) Next what he had to do was isolate the meaningful bits of the image by removing the background. This was going to be pretty simple I thought. What I decided to do was go through every pixel and if the pixel had a value greater than 0 I incremented a counter and added that value to a variable. I also had a variable keeping track of the highest value it came across for later use. After the loop completes I divided that value by the counter to get a final value which represents the average intensity of all the meaningful bits (bits which weren't 0) in the picture. They then looked like this:
GFP:

TxRed:

3) His next step was to overlap them. I simply did this by filling in all the green values (which were all 0s) in the red original image with values in the original green image, I say original because these were untouched images not the images I removed the background from in step2. This produced an image with areas of only red intensities, some areas of only green intensities and potentially ares where there was red and green intensities which would give shades of yellow and yellows which lean towards green or leans towards red. This wasn't a very good image in some cases as some of the intensities were very slight and result in images which weren't all that easy to spot localization.
Like so:

Even with overlapping the 2 images where I removed the backgrounds didn't look that much better:

I mean you can generally see where it potentially localizes (I say potentially because in all fairness I have no idea what i'm talking about lol) but its not very defined, lack of resolution I guess would be the technical statement here. So I decided to increase that. Now I can't just go in and arbitrarily change values without some kind of control. I needed something which is consistent and controlled which could be applied to all the images. Well I thought there is a gap between 0 and the average value I computed in step 2, and also a gap between the high intensity value I also found in part2 and the max value possible 255, lets stretch what ever the value is for each pixel linearly with those 2 gaps in mind. Doing this made it so that the lowest intensity value after removing the background mapped to 0 and the highest intensity found is mapped to 255 and any value in between is linearly and proportionately mapped somewhere between 0 and 255. I came up with the following formula Y = (X - A) / (H - A) where H is the highest intensity value obtained in step2 and A is the average meaningful intensity value obtained in step2. Y was then set to 255 if the resulting calculation was greater than 255.
After doing this the images were much more defined in terms of color, and structures that you couldn't see before popped out:
GFP:

TxRed:

And the overlay composed from these two images were much more telling:

Now that I had the image finalized I had to use it to compute how much of it was potentially localizing. This took me the longest time as this was mostly statistics and boy do I hate statistics. I ultimately decided to take the average of 2 methods I designed after I computed a couple things for both methods to work with.
One thing I needed to calculate was a new average. Since I was going to analyze both images and hence 2 channels I couldn't use the individual averages obtained in step2. I decided to start off by setting the initial new average to the sum of the the average computed in step2 from both images and dividing by 2. This essentially gives me the average of the averages lol. I then iterated through all the pixels of the overlay shown in step3 and for every pixel which value is greater than or equal to the new average, add that value to a variable T for later use and increment a counter variable. A new channel average was calculated by dividing T by the counter variable . I did this separately for both the green and red channel. The finalized new average was then calculated by adding the new averages from the green channel and the red channel and dividing by 2. With these new averages (RedAverage, GreenAverage, RedGreenAverage) I was then able to compute using the two methods. Both methods share a condition and that being the pixel is only considered if its green intensity value is greater than or equals to the RedGreenAverage. We use green because that is the channel of interest. We want to see if the red overlays the green.
Method1:
There is a variable called GT which gets added to.
There is a variable called RT which gets added to.
If green intensity is greater than or equal to GreenAverage and if red intensity is greater than or equal to RedAverage then add 2 to GT and add 2 to RT.
If green intensity is greater than or equal to GreenAverage and if red intensity is less than RedAverage then add 2 to GT and add 1 to RT.
If green intensity is less than GreenAverrage and if red intensity is greater than or equal to RedAverage then add 1 to GT and add 1 to RT.
If green intensity is less than GreenAverage and if red intensity is less than RedAverage then add 1 to GT.
Method2:
There is a variable called GT2 which gets added to.
There is a variable called RT2 which gets added to.
Add 255 to GT2 (the reason we use 255 is GT2 stores the green values and green represents the protein or the interest and thus if its there at all it should be viewed at the most importance and so 100 percent which in this context is 255.
If red intensity is greater than 0 then add red intensity to RT2.
Finally I do ((((((RT / GT) * 100) - 50) * 100) / 50) + ((RT2 / GT2) * 100)) / 2
For this particular image I got ~%82 Localization.
All that is left was to make it do batch processing of multiple pairs of images and output all the percentages to a csv file and I was done. This program took me about 2 days to program and my friend checked a bunch of times for consistency and for any false positives throughout its development. He likes to state that this program is better than imageJ and while that maybe true for him in this particular use case. I wouldn't count imageJ out of the picture as it is much more featured and I like to think that the two programs just work differently is all.
Download: http://www.mediafire.com/file/u2325y0ggsr8h1v/LocalityProcessor.exe
ScreenShot:

The Task:
1) So what he needed to do originally in ImageJ was to essentially greyscale 2 to 3 images.
2) Next he needed to isolate meaningful structures out of it by removing the background.
3) Then came the part where he would have to take those 2or3 images and overlap them.
4) Calculate the percentage at which the two overlap which would signify localization.
*There are more detailed steps that he had to do but I don't entirely remember.
So lets make a checklist to show the process of me making this program for him:
I will be using these 2 images to demonstrate.
GFP:
TxRed:
1) First I needed to greyscale the images. I didn't see a need for this as the images provided were already only in 1 channel each.
Like the first image only had values in the red channel and image 2 only had values in the green channel, etc. These values were 0-255 so if you look at it simply by their values per channel then its already kind of a greyscale image. So I guess that is done.
2) Next what he had to do was isolate the meaningful bits of the image by removing the background. This was going to be pretty simple I thought. What I decided to do was go through every pixel and if the pixel had a value greater than 0 I incremented a counter and added that value to a variable. I also had a variable keeping track of the highest value it came across for later use. After the loop completes I divided that value by the counter to get a final value which represents the average intensity of all the meaningful bits (bits which weren't 0) in the picture. They then looked like this:
GFP:

TxRed:

3) His next step was to overlap them. I simply did this by filling in all the green values (which were all 0s) in the red original image with values in the original green image, I say original because these were untouched images not the images I removed the background from in step2. This produced an image with areas of only red intensities, some areas of only green intensities and potentially ares where there was red and green intensities which would give shades of yellow and yellows which lean towards green or leans towards red. This wasn't a very good image in some cases as some of the intensities were very slight and result in images which weren't all that easy to spot localization.
Like so:

Even with overlapping the 2 images where I removed the backgrounds didn't look that much better:

I mean you can generally see where it potentially localizes (I say potentially because in all fairness I have no idea what i'm talking about lol) but its not very defined, lack of resolution I guess would be the technical statement here. So I decided to increase that. Now I can't just go in and arbitrarily change values without some kind of control. I needed something which is consistent and controlled which could be applied to all the images. Well I thought there is a gap between 0 and the average value I computed in step 2, and also a gap between the high intensity value I also found in part2 and the max value possible 255, lets stretch what ever the value is for each pixel linearly with those 2 gaps in mind. Doing this made it so that the lowest intensity value after removing the background mapped to 0 and the highest intensity found is mapped to 255 and any value in between is linearly and proportionately mapped somewhere between 0 and 255. I came up with the following formula Y = (X - A) / (H - A) where H is the highest intensity value obtained in step2 and A is the average meaningful intensity value obtained in step2. Y was then set to 255 if the resulting calculation was greater than 255.
After doing this the images were much more defined in terms of color, and structures that you couldn't see before popped out:
GFP:

TxRed:

And the overlay composed from these two images were much more telling:

Now that I had the image finalized I had to use it to compute how much of it was potentially localizing. This took me the longest time as this was mostly statistics and boy do I hate statistics. I ultimately decided to take the average of 2 methods I designed after I computed a couple things for both methods to work with.
One thing I needed to calculate was a new average. Since I was going to analyze both images and hence 2 channels I couldn't use the individual averages obtained in step2. I decided to start off by setting the initial new average to the sum of the the average computed in step2 from both images and dividing by 2. This essentially gives me the average of the averages lol. I then iterated through all the pixels of the overlay shown in step3 and for every pixel which value is greater than or equal to the new average, add that value to a variable T for later use and increment a counter variable. A new channel average was calculated by dividing T by the counter variable . I did this separately for both the green and red channel. The finalized new average was then calculated by adding the new averages from the green channel and the red channel and dividing by 2. With these new averages (RedAverage, GreenAverage, RedGreenAverage) I was then able to compute using the two methods. Both methods share a condition and that being the pixel is only considered if its green intensity value is greater than or equals to the RedGreenAverage. We use green because that is the channel of interest. We want to see if the red overlays the green.
Method1:
There is a variable called GT which gets added to.
There is a variable called RT which gets added to.
If green intensity is greater than or equal to GreenAverage and if red intensity is greater than or equal to RedAverage then add 2 to GT and add 2 to RT.
If green intensity is greater than or equal to GreenAverage and if red intensity is less than RedAverage then add 2 to GT and add 1 to RT.
If green intensity is less than GreenAverrage and if red intensity is greater than or equal to RedAverage then add 1 to GT and add 1 to RT.
If green intensity is less than GreenAverage and if red intensity is less than RedAverage then add 1 to GT.
Method2:
There is a variable called GT2 which gets added to.
There is a variable called RT2 which gets added to.
Add 255 to GT2 (the reason we use 255 is GT2 stores the green values and green represents the protein or the interest and thus if its there at all it should be viewed at the most importance and so 100 percent which in this context is 255.
If red intensity is greater than 0 then add red intensity to RT2.
Finally I do ((((((RT / GT) * 100) - 50) * 100) / 50) + ((RT2 / GT2) * 100)) / 2
For this particular image I got ~%82 Localization.
All that is left was to make it do batch processing of multiple pairs of images and output all the percentages to a csv file and I was done. This program took me about 2 days to program and my friend checked a bunch of times for consistency and for any false positives throughout its development. He likes to state that this program is better than imageJ and while that maybe true for him in this particular use case. I wouldn't count imageJ out of the picture as it is much more featured and I like to think that the two programs just work differently is all.
Download: http://www.mediafire.com/file/u2325y0ggsr8h1v/LocalityProcessor.exe
ScreenShot:

Tuesday, August 8, 2017
JEDEC vs IEC standards
What is a kilobyte? To some it maybe 1000 bytes and others it maybe 1024 bytes. Why the difference? which one is correct? The computer world seems to be confused as to which convention to use. On one side there is the original JEDEC standard which specifies that 1024 bytes are in a kilobyte and 1024 kilobytes are in a megabyte etc. Then on the other there is the IEC standard which states that 1000 bytes are in a kilobyte and 1000 kilobytes are in a megabyte etc. What are the difference between these two standards and their practical uses.
Personally I follow the JEDEC standard because as a programmer it makes much more sense to me. If we look at numbering systems we will see the pattern that for each place value it is a power of the original base value. For example the first few place values of binary are 1,2,4,8,16,32, etc. If we take the smallest unit for typical computers (the bit) which is also base2 we can extend the pattern and see that 1024 is a place value. Which means using 1024 would be nice as it lines up when working with bits. The IEC standard on the other hand uses 1000 and isn't found as a place value in binary which will lead to inconvenient alignment issues.
Well then why do we have the IEC standard at all? I personally believe its because of marketing. When you buy a new hard drive which is say 1TB you are expecting to get the whole 1TB but on some operating systems like windows you might be confused to find that you only get about 931.323GB. This is because the labeling on hard drives use the IEC standard and windows uses the JEDEC standard. For marketing reasons the IEC standard is used on hard drive labels because 1000 definitely looks better than 931.323 and ignorant people just go with the flow. The IEC standard also accounts for the programmers by simply renaming kilo to kibi and and mega to mebi etc although I'd argue that they did so pointlessly. I do not see any real reason to make such a conversion. I also do not see why we have to cater to the consumer which have no idea how the technology works. File systems for instance and hard drive allocation tables under the hood goes by powers of 2. You might find that sector size of your hard drive is 512 bytes and event the Advanced format is at 4096Bytes, because it is power of 2 you will never have a sector that is 1000bytes in length or 4000bytes in length which will miss-align later once you get to kilobyte on the IEC standard (using kilo, mega, giga etc). Computers simply aren't base 10, and there simply isn't 10 bits to a byte. Maybe if there were 10 bits to a byte we can officially and nicely move over to IEC (and get rid of those weird kibi, mebi naming schemes).

Which is completely possible. The size of the byte as we know it now is 8bits but the byte has been 5bits, 6bits, 7bits in the past. Bytes have even gone higher than 8 bits with some systems using 20bits to a byte. The number of bits to a byte these days though have some preferences such as the number of bits have to be a multiple of 2, so essentially it has to be an even number of bits, and 10bits satisfies that. So until I personally see 10bit bytes I don't see any reason to use a standard other than the JEDEC standard. Both are correct but only one makes practical sense to me.
Personally I follow the JEDEC standard because as a programmer it makes much more sense to me. If we look at numbering systems we will see the pattern that for each place value it is a power of the original base value. For example the first few place values of binary are 1,2,4,8,16,32, etc. If we take the smallest unit for typical computers (the bit) which is also base2 we can extend the pattern and see that 1024 is a place value. Which means using 1024 would be nice as it lines up when working with bits. The IEC standard on the other hand uses 1000 and isn't found as a place value in binary which will lead to inconvenient alignment issues.
Well then why do we have the IEC standard at all? I personally believe its because of marketing. When you buy a new hard drive which is say 1TB you are expecting to get the whole 1TB but on some operating systems like windows you might be confused to find that you only get about 931.323GB. This is because the labeling on hard drives use the IEC standard and windows uses the JEDEC standard. For marketing reasons the IEC standard is used on hard drive labels because 1000 definitely looks better than 931.323 and ignorant people just go with the flow. The IEC standard also accounts for the programmers by simply renaming kilo to kibi and and mega to mebi etc although I'd argue that they did so pointlessly. I do not see any real reason to make such a conversion. I also do not see why we have to cater to the consumer which have no idea how the technology works. File systems for instance and hard drive allocation tables under the hood goes by powers of 2. You might find that sector size of your hard drive is 512 bytes and event the Advanced format is at 4096Bytes, because it is power of 2 you will never have a sector that is 1000bytes in length or 4000bytes in length which will miss-align later once you get to kilobyte on the IEC standard (using kilo, mega, giga etc). Computers simply aren't base 10, and there simply isn't 10 bits to a byte. Maybe if there were 10 bits to a byte we can officially and nicely move over to IEC (and get rid of those weird kibi, mebi naming schemes).
Which is completely possible. The size of the byte as we know it now is 8bits but the byte has been 5bits, 6bits, 7bits in the past. Bytes have even gone higher than 8 bits with some systems using 20bits to a byte. The number of bits to a byte these days though have some preferences such as the number of bits have to be a multiple of 2, so essentially it has to be an even number of bits, and 10bits satisfies that. So until I personally see 10bit bytes I don't see any reason to use a standard other than the JEDEC standard. Both are correct but only one makes practical sense to me.
Tuesday, March 14, 2017
Differences In Image Formats
So I know a person who back in my Java 1 class thought it would be cool to show me a trick. Essentially the trick was (he thought) that he can convert an image from one format to another simply by changing its extension. Needless to say I wasn't impressed, in fact I got pretty angry. I told him "No you didn't convert the image, you only changed the extension". He continued to state that he did since it worked. Now just because the software you are using is smart enough to detect the actual format of an image or dumb enough to abandon standards to do that is irrelevant. In this post I will describe the basics of what makes an image format different from another.


PNG Header:

Note: JPG has several different headers depending on options and type. You can see from the image I posted above that the JPG used here is of the EXIF type.
Now we can see that the structures of the image is completely different. A JPG decoder can not interpret a meaningful image if it tried to decode a PNG and vice versa.
Even if the headers were the same the inner workings of the two formats would be completely different which leads use to the encoding and decoding of the image data.
Encode/Decode:
JPG works by use of huffman tables and quantization tables. These tables are computed and is what gives the image the compression and lossy factors. This is also what allows different encoded images to be decoded the same way.
PNG on the other hand uses compressed chunks. Chunks are used so that PNG can be presented in a streamed manner but the image is encoded typically using a compression algorithm of the lossless kind. This gives per-pixel integrity at the cost of usually producing a larger file size (than JPG).
Extension:
Now the extension is the first difference which everyone sees and is arguably the first difference to be noticed. It is simply text appended to the end of the filename. In terms of image formats you might have BMP, PNG, GIF, JPG, TIFF, WEBP, etc...
The extension though is only related to the file name, it is NOT related to the actual data of the file. The file name doesn't reside as data in the image, if you look at the file in a hex editor you will not find the filename. The filename and extension is for allocation in the file system used. If you open the allocation table of your drive you then will see it there. So changing the extension doesn't even change a single bit in the image file.
Header:
The header of an image format or any file format specification is actually in the data. Changing this might or might not affect the use of the file depending on where in the header you mess with. There are several parts in the header and each format has a different type and number of headers but typically the Magic/Signature is the first thing you will see.
Magic:
The Magic is the first few bytes which identifies what format the file is in and in some cases provide metadata. Parsing this will allow the ability to know the file's format but even more importantly its structure. Here you can see the Magic between the same image but one in JPG and one in PNG.
I'm not going to explain the entire header of these two formats but I will present them so that the difference can be seen.
JPG Header:
JPG Header:
Note: JPG has several different headers depending on options and type. You can see from the image I posted above that the JPG used here is of the EXIF type.
Now we can see that the structures of the image is completely different. A JPG decoder can not interpret a meaningful image if it tried to decode a PNG and vice versa.
Even if the headers were the same the inner workings of the two formats would be completely different which leads use to the encoding and decoding of the image data.
Encode/Decode:
JPG works by use of huffman tables and quantization tables. These tables are computed and is what gives the image the compression and lossy factors. This is also what allows different encoded images to be decoded the same way.
PNG on the other hand uses compressed chunks. Chunks are used so that PNG can be presented in a streamed manner but the image is encoded typically using a compression algorithm of the lossless kind. This gives per-pixel integrity at the cost of usually producing a larger file size (than JPG).
Thursday, February 23, 2017
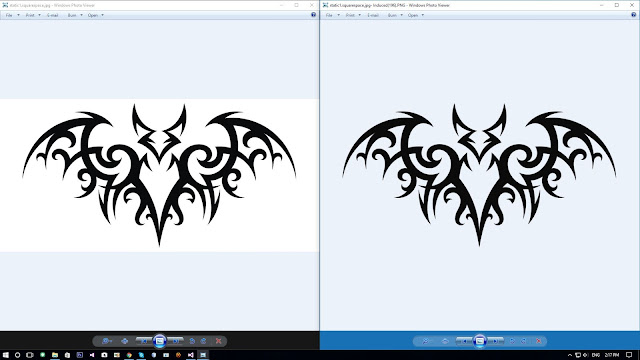
ImageTransparencyInducer
This is a tool I made for people who draw on paper and plan to scan their work onto the computer. Typically these scans look very unprofessional due to the paper gradient the drawing is on. for example this drawing I found on google:

Typically its line art which go through this process from what I see my friends do. The process can be done in photoshop or other editing tools but its tedius. I thought hmm, I can make a program which eases everything. The outcome looks like this:

The program has only one option to adjust which is the threshold. The threshold controls how light or how dark a pixel can be to be kept in the image or left out completely (turns it 100 percent transparent). Messing around with this might or might not enable you to get the results you want. Too High and it might keep artifacts or defects in your image which you wanted out, adjust it too low and it might leave out details which you might wanted to keep.
DOWNLOAD: ImageTransparencyInducer
Here are some other before and after examples:


Typically its line art which go through this process from what I see my friends do. The process can be done in photoshop or other editing tools but its tedius. I thought hmm, I can make a program which eases everything. The outcome looks like this:
The program has only one option to adjust which is the threshold. The threshold controls how light or how dark a pixel can be to be kept in the image or left out completely (turns it 100 percent transparent). Messing around with this might or might not enable you to get the results you want. Too High and it might keep artifacts or defects in your image which you wanted out, adjust it too low and it might leave out details which you might wanted to keep.
DOWNLOAD: ImageTransparencyInducer
Here are some other before and after examples:


Subscribe to:
Posts (Atom)